Hey data team – why does the revenue in my dashboard not match the revenue in this other view? -Every Executive Ever
If you’ve been in data analytics for any amount of time, I’m sure you can relate to a question like this. Often, the answer is that the analyst who did the calculation for one view did a slightly different calculation the second time around. Maybe that analyst was you!
Fix this using a modeling layer in your analytics stack.
I agree with Tristan Handy’s analytics for startups view of the world. Once you’ve read that (or some of my past posts), you know that you should have an ingest layer, a modeling layer, and a visualization layer.
Note that there’s definite overloaded and confusing terminology in the industry around the word modeling. I specifically am not talking about building a machine learning model, a financial model, or any sort of projection or analysis. I’m talking about dimensional modeling.
Why do I even need this layer?
Consistency, repeatability, and time-savings
Most beginner analysts will work with the data as-is. The lowest-impact request you can make of an engineering team is a read-only replica of the database. The problem here is that data in a production database is optimized for production use cases – not analysis or BI.
There’s probably no history of changes, it may not allow window functions, and standard analytical queries will take a join of several tables.
On the other hand, a data warehouse that’s optimized for analytics will have a totally different structure. It will denormalize many of the database tables, will store the history of slowly changing dimensions, and will flatten tables into a 1-per-transaction or 1-per-business-entity structure so that table counts and sums make sense.
Perhaps most importantly, well-modeled data is reusable across multiple analyses. When someone asks for user count, a well-modeled users dimension is the go-to place. When you ask about revenue, there’s a single source of truth for that number instead of every analyst creating their own calculation off-the-cuff. This way you’ll get less of the questions that started this post!
Every time an analyst or data scientist is able to use well-modeled data instead of having to reinvent the wheel, there’s huge time-savings associated.
There are literal books written on this subject, so giving you an entire data warehouse philosophy is not my intent here. The current head of the Zapier data team Muness Castle recommends the Kimball modeling book The Data Warehouse Toolkit. If you want more information about how and why you should structure your data warehouse, go read it! If that doesn’t sell you on the need for this intermediate step in your analyses, let me know, and I’ll work on a post specifically about this!
For the rest of this piece, I want to evaluate a number of common options for implementing this modeling layer.
Maybe the most common option: Roll your own (SQL queries, python scripts, etc)
Without well-formed thoughts around data modeling and analysts’ needs at a company level, it’s likely that a Data Analyst or Data Scientist will end up adhoc modeling what they need as the need it.
This path requires the least up front spend and is the fastest implementation. It’s also the default path that will happen with no planning. So that’s a benefit, I guess.
But seriously! If you plan to be a data-driven organization (enough that you have someone thinking about these types of data structures at all), don’t let inertia carry you! If you invest the time up front, you’ll solve a ton of heartburn for yourself, later.
So, what are our better options?
DBT
Tristan and Fishtown’s vision for DBT is
a command line tool that enables data analysts and engineers to transform data in their warehouses more effectively.
He wants to provide an opensource, transferable skillset and framework that analysts can work in, and maintain data models in their warehouse. This is an extremely noble goal, and I’m a supporter.
Benefits
DBT is mostly a SQL-focused tool.
Most strong analysts already have a strong SQL background, and the learnings that they have while working with DBT will instantly transfer to skills that they use in a normal day-to-day.
The team is adding new functionality regularly, and are in it for the long haul.
Plus the DBT slack community is by far the best tech/startup analytics community that I’ve discovered.
Easy, strong version control and diff checks.
Since dbt relies on git code commits, most code review processes transfer quite effectively. It’s easy to see what changed between versions and rollback if ever needed. Spend a couple hours with a strong software engineering manager and you can borrow/steal all of their code review best practices.
Tests.
Dbt includes a test yaml functionality to define non-null, unique, and referenced fields. We essentially rebuilt a more robust version of this type of functionality internally at Zapier because of our combination of airflow and matillion, but we could have gotten a lot of mileage out of the DBT version if we were standardized over there.
Open Source!
For a variety of data sources, the DBT contributors (Fishtown and otherwise) have a respectable number of modeling already available open source: Stripe, Snowplow, and more.
Downsides
As of the time of this writing, DBT is still a young product. There are many edges remaining.
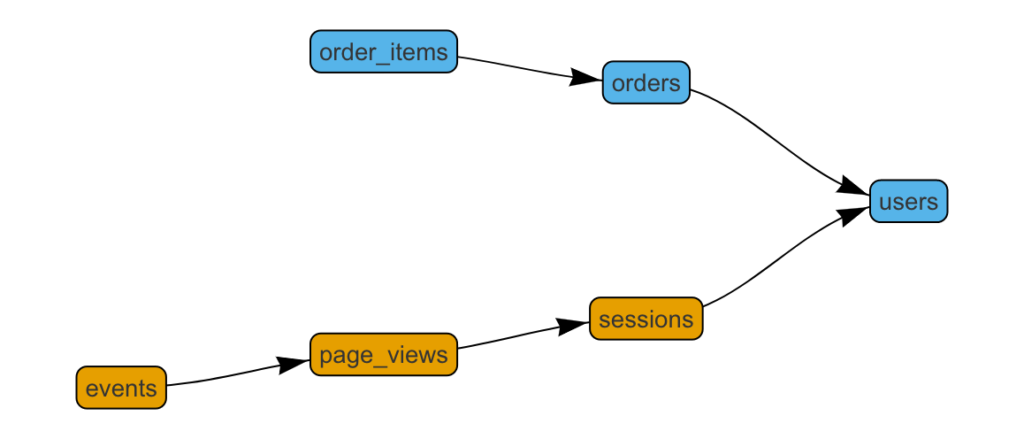
It’s 100% code as of the last time I used it – which can feel intimidating to new entrants. I know that the team is working to improve the workflow and setup process so that it’s more analyst friendly, but for now you need a decent understanding of git (or at least a git cheat sheet) in order to use it and you need a moderate level of git/github knowledge to get it setup. They did recently add in a viz tool for seeing your DBT graph.
Complex orchestrations can be difficult to navigate. Note that they do support hundreds of models being built – it’s not to say it’s impossible, only less clean than some other options. Essentially, DBT has a concept of ref() models, where if b includes ref(a), then b will build after a. Orchestration / notification beyond that is somewhat lacking – ~controlled serialization vs parallelization can be concerning last time I used it~ (See Edit). Navigation up-and-down the model hierarchy is easier for me in a GUI than in git.
However, the Fishtown team also offers Sinter Data which allows for some of the orchestration control that DBT doesn’t natively include. Or you can run DBT via airflow, etc – it’s worth understanding that you’ll have to use something in addition to the DBT base to schedule/notify/etc.
`\ Edit: I chatted with Tristan after posting this and he has a couple of valid points that are worth putting in here: DBT’s vision for parallelization is to “just handle it”. They’re trying to make it so that the analyst doesn’t even have to think about it. This is a great vision! Also, it’s been ~9 months since I did a fresh DBT rollout, which is a long time in new-product-years. They’ve done a bunch of work on parallelization since then: “We run 4-8 threads on all projects now. 4 on redshift, 8 on BQ and Snowflake.”
Cost
It’s opensource! So no out of pocket cost up front.
Matillion ETL
Matillion ETL is essentially a gui-ized version of SQL modeling functionality
Upsides:
Breakout of transformation and orchestration jobs helps readability.
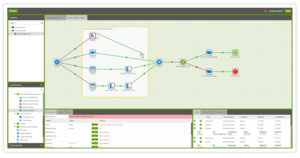
A GUI is a great way of modeling out chains of events that naturally occur during data modeling. The Matillion interface does quite a good job of showing the builder’s preference for what should happen in what order. It ends up building out chains of SQL queries to run on your cluster based on the commands that you give it. That technically means that SQL knowledge isn’t required – though I’m not sure that I’d recommend using it without baseline SQL understanding.
Some level of ingest services included!
This is where this post and my data pipelines post start to overlap heavily. Matillion includes a broad range of integrations to ingest data from third parties, just like ingest tools. We are heavy users of the Google Sheets ingest, for sure. That said, we also tried several others with varying degrees of success, so it’s not all sunshine and roses.
SQL and python components included.
That means that if you want to fall-back to writing custom code, you can. I’ve used this for date logic that needs to update itself during our overnight ETL.
Downsides:
Search – I know that search is hard, but following a single data field all the way through a chain of 5 matillion transformations is pretty difficult. It feels like it should have highlight functionality like when you search for something in apple system preferences.
Because it ends up writing huge nested SQL queries, it can leave the Redshift query optimizer in a terrible state. We often have to break large single queries down into smaller chunks and materialize temp tables with proper keys to make a large join later in the sequence work. This isn’t a problem unique to Matillion by any means, but it’s especially apparent when the query that you were trying to do all at once takes far too long to run. Plus the GUI makes it easy to overburden the cluster with a massive query.
Cost
Matillion has an hourly or yearly cost that can be found on their site. At the moment, the yearly pricing ranges from $10k-40k/year.
LookML
One of looker’s most noteworthy points of differentiation around their web BI competitors is that they seemed to pioneer an embedded ETL / modeling layer as a component of their BI and Visualization product. I realize that they weren’t the first to have this type of offering – many of the old-school BI products presumably have this as well. But, they’re the first of the new generation of cloud-first tools to do so.
Benefits
If you’re already in the market for a BI tool, too, the integration here is a clear win if you decide to go with Looker. Writing LookML is quite fast once you get used to it. Plus there’s built-in integration with github version control (without the need to actually know how to use git!) LookML also bakes in some neat data types that aren’t necessarily baked in to SQL or your database. It lets you have a bunch of date formats and tiers, locations, and distances, plus generic “number” type that often feels easier to work with than the SQL versions.
Drawbacks
There’s a huge amount of lock-in associated with relying on LookML as your modeling layer. It means that it’s more difficult for your non-BI data scientists to access your clean, modeled data (this is a huge risk!). In my consulting time, I helped with a couple rip-and-replace jobs in order to recreate all of the LookML data models in a way that allowed broader access to these “official” modeled data stores.
Orchestrations and visuals between models are both off the table. Since this is designed as prep work feeding a BI tool, and not much else, the tooling around specific orchestration and showing how models relate and rely on one another is not great.
Cost
Depends how you’re thinking about it – looker is is the neighborhood of $40k/year minimum, but if you’re already planning on it, then there’s no added cost.
Other tools and thoughts/comments.
Airflow
For the slightly more technical, airflow offers orchestration that can wrap python jobs, or work with DBT and other tools mentioned above. It has quite a following, and I asked one of Zapier’s Data Engineers, Scott Halgrim, to chime in with thoughts on how it plays in the modeling layer space. Here are his thoughts:
Apache Airflow is a platform with which you can programmatically author workflows. Airflow uses the concept of a directed acyclic graph (DAG) for specifying workflows, which is a boon for visualization. The nodes in the DAGs are operators, each of which does some part of the work.
Benefits
Airflow’s greatest strength is probably that its open source code is written in Python, one of the most popular and rapidly growing programming languages today. Even if you don’t formally have any Python capabilities in your shop, you probably can find some engineers or analysts who know Python just by asking around the office. Since DAGs are all written in Python as well, you get nice features like text-based version control (philosophically similar to DBT), easy code reviews, and code-as-documentation built right in. Airflow is also feature rich, and offers a command line interface, DAG branching and conditional processing, and a web-based UI for easy re-running or back-filling of tasks, among others.
Drawbacks
Airflow can be a little unruly in the way it manages resources. If you’re not careful you can very quickly get out-of-memory errors, end up with a scheduler that doesn’t know what is happening with the tasks it has kicked off, and a variety of other “weird” behaviors that are hard to debug. Many of these problems can be resolved through scaling up your workers, though, if that’s a possibility for you.
ETLeap
I’ve heard good things, but never used it myself.
Luigi
This competitor to airflow I also have little experience with, but has been used extremely well as seen in a post by Samson Hu who has also written some other terrific pieces in this space.
So, my recommendations? Try DBT first.
If I were setting up infrastructure from scratch, I’d probably go with DBT. The opensource nature makes it low-risk, and I believe in the Fishtown team. I also love that because it’s SQL-based, the skills that your team learns while maintaining it will transfer to other parts of the job.
Any tools I missed? Any more questions? Let me know!


